Live plant data
Numbers from operating plants, not projections.
Every figure on this page was recorded at an active facility under real load conditions.
No lab averages. No benchmarks from other vendors.
Some of our reputable clientele:
Measured Outcomes
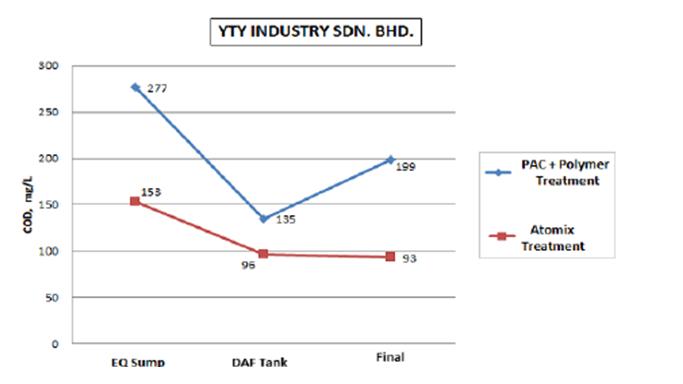
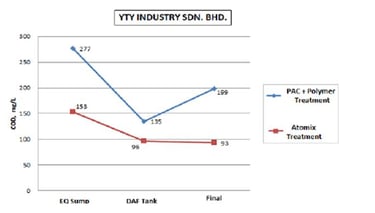
What the data shows across plants
>95%
>20%
Up to 30%
Up to 99%+
Lower chemical consumption per cubic metre treated — cost of treatment drops while effluent quality holds or improves.
Compliance stability across monitored discharge points — no exceedance events during Atomix-dosed operating periods.
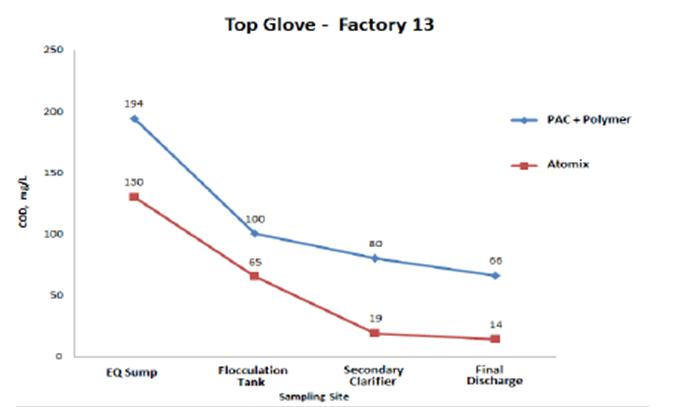
Improvement in COD removal, recorded at food and dairy plants running continuous 24-hour discharge cycles.
Reduction in sludge volume, measured by dry-weight comparison before and after Atomix MTA dosing protocol.
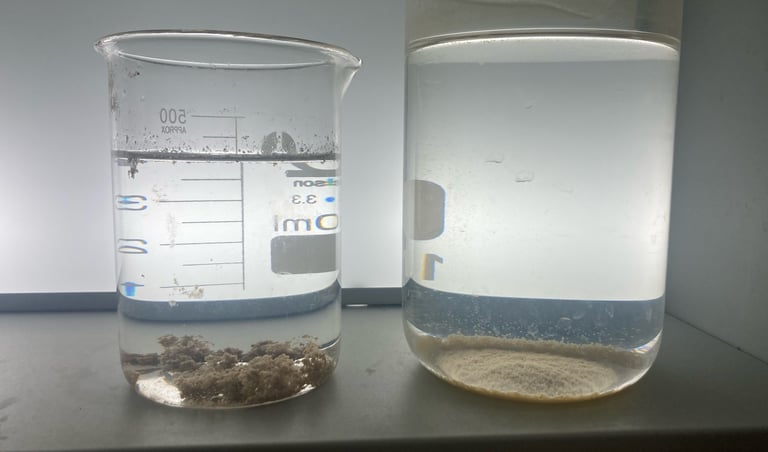
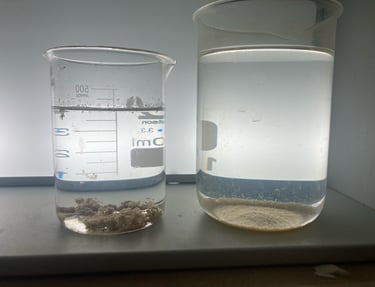
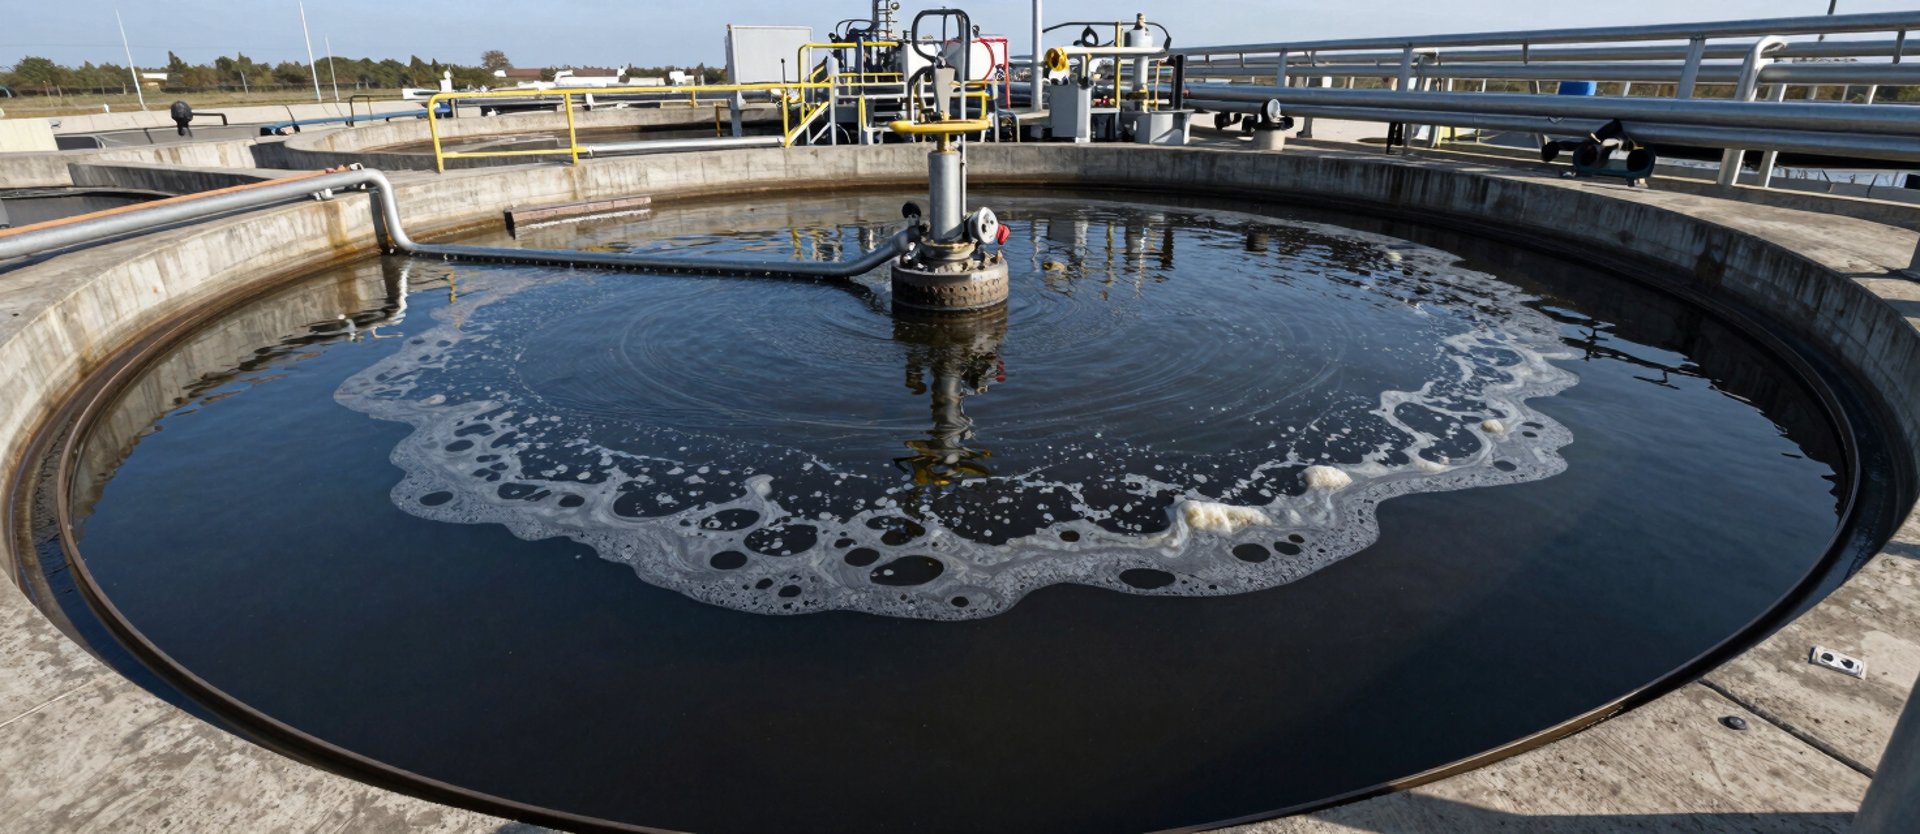
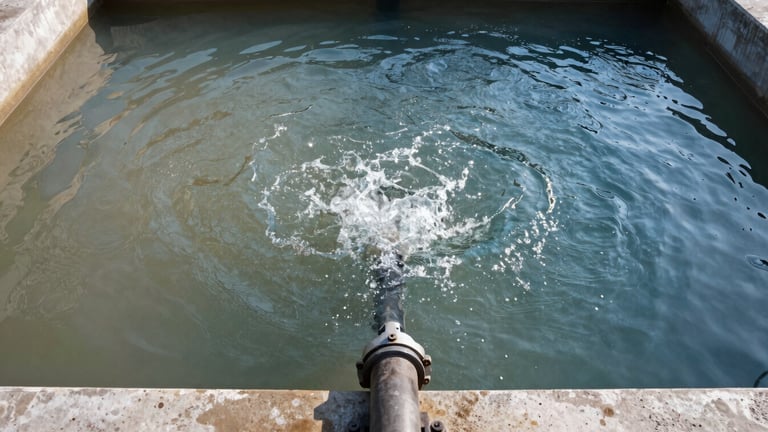
Atomix MTA treatment after 3 mins
PAC/Polymer treatment after 20 mins

Watch treatment performance under actual load
Filmed at operating facilities during active dosing cycles.
Contact us to see the Atomix MTA advantage.

Your plant, your numbers
See what these figures look like at your facility.
We assess your current load profile — COD, sludge rate, chemical spend — and show you where the gaps are before we recommend anything.
Measured in parts per million.
Proven in your plant.
Pages
Get in touch
info@atomixmta.my
+6011-6628 8939
No. 44, 47, Jalan P/AM 3,
Arab Malaysian Industrial Park,
71800, Nilai, Negeri Sembilan, Malaysia
©2026 Atomix MTA-Proven in operating plants across Malaysia and Asia.
Compliance is not optional